

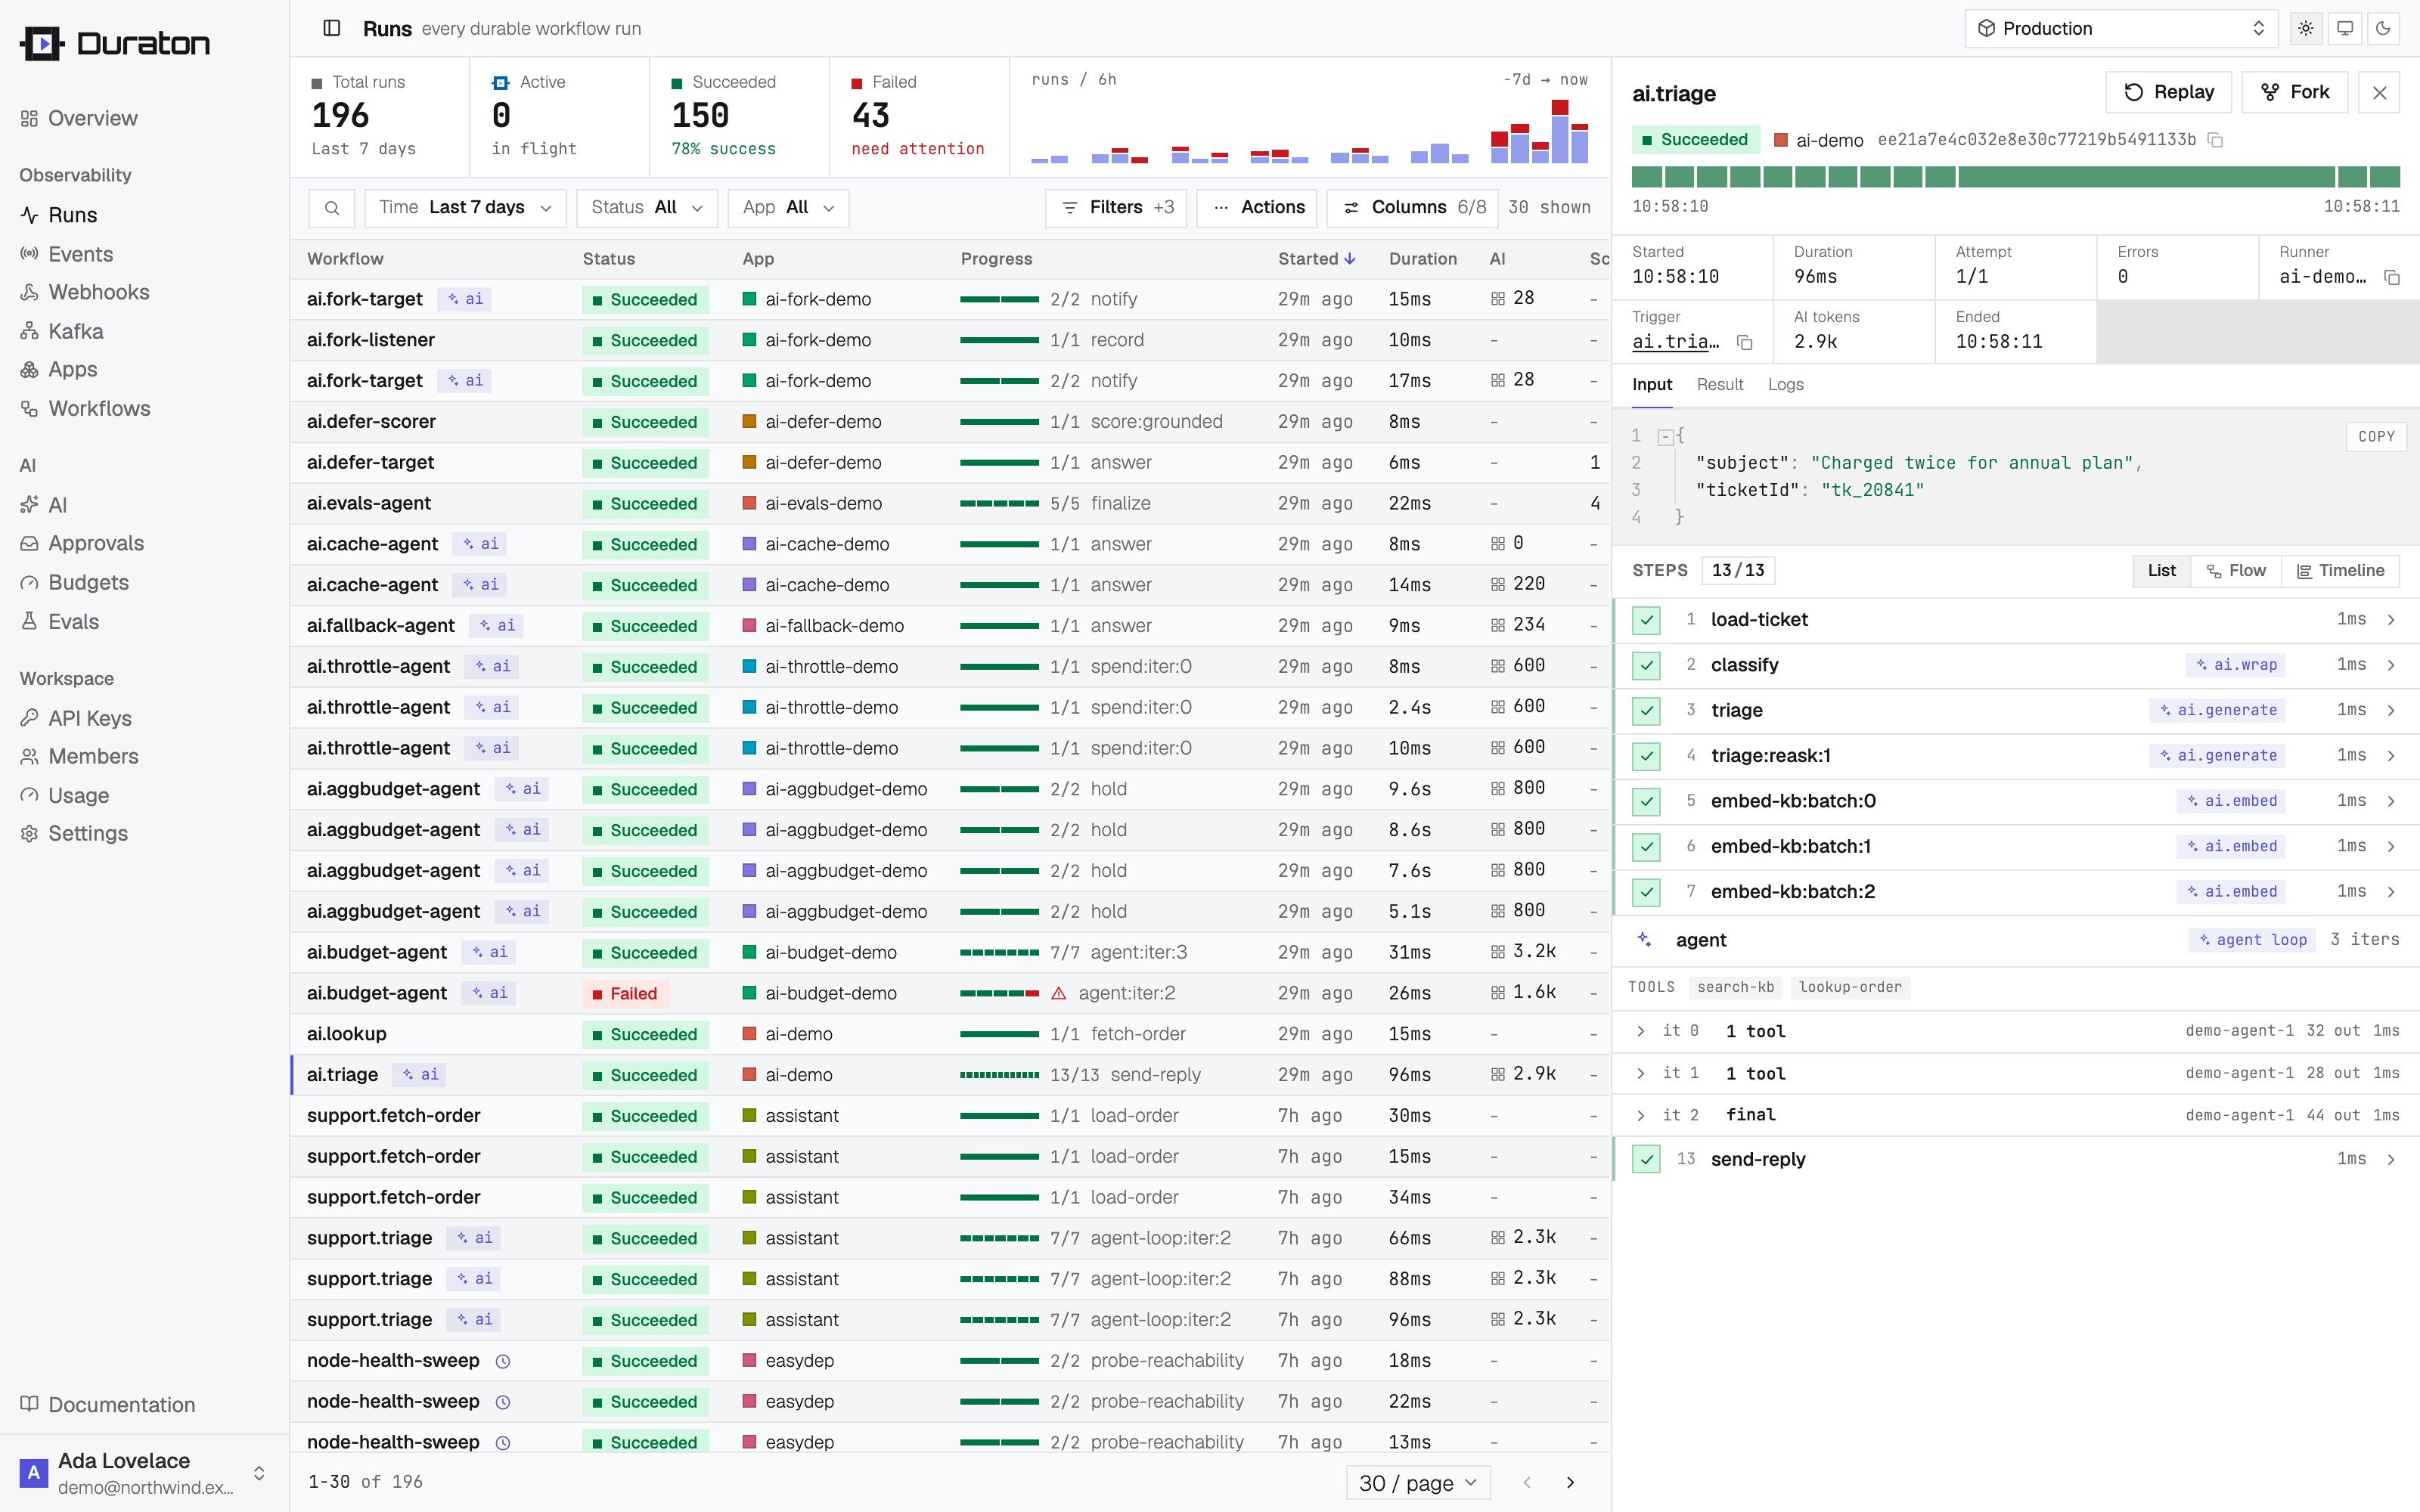
Listing & filtering
GET /runs accepts these query parameters:
deep=1 widens the scan from indexed run metadata to the run’s stored JSON, so bound it: the payload
scan runs inside whatever other filters you apply (since, status, app), and on a busy project a
narrow time window is the difference between an index lookup and a full scan.
- TypeScript
- REST API
triggerKind - one of event, cron, or manual (see trigger
kinds) - so a scheduled or manually-started run is
distinguishable both in the list and on the run object.
An event-triggered run also carries eventName and eventId - the event that fanned it out
(event->run lineage). eventId matches the event log’s id, so GET /runs?eventId=<id> returns
every run one event produced, and a run links back to its exact event. Cron, child
(step.runWorkflow), and on-failure runs have no eventId.
A run created by replay or retry-from-step carries replayOf - the id of the
source run it was forked from (replay->run lineage). GET /runs?replayOf=<id> returns every run
forked from one source, and the new run links back to its origin. Original runs have no replayOf.
A run spawned by a step.runWorkflow call - a workflow-backed agent
tool included - carries the call edge it was spawned on (call->run
lineage): parentRunId (the run that spawned it), parentStep (the step it was spawned on) and
parentAttempt (which attempt of that step spawned it). The spawning step carries childRunId back,
so the edge is followable both ways. GET /runs?parentRunId=<id> returns every child one run
started - exact equality on one nesting level, so direct children only, never grandchildren.
Top-level runs carry none of the three, and neither does a run triggered by an event another run
emitted: only a runWorkflow call sets this edge.
Every run also carries depth, its causal nesting, absent (0) at the top. A runWorkflow child
is its parent’s depth + 1, and an emit-triggered run is the emitting run’s + 1 - so
a run can sit at depth > 0 with no parentRunId at all.
Run tags
Tags are customer-defined key/value metadata you attach to a run so you can slice runs by your own dimensions -customerId, region, plan, batchId, whatever you name. Every run carries its tags
as a tags object on the run, and GET /runs?tag.<key>=<value> filters by them, index-backed (no
full scan). The same filter applies to GET /runs/stats.
Set tags in two places:
- On an event (
events.send/POST /events): the event’s tags attach to every run it triggers - natural for “tag all runs from this webhook / customer”. - On a child run (
step.runWorkflow): the tags apply to that child run.
step.runWorkflow child inherits its parent run’s tags and merges its own on top,
with the child’s value winning on a shared key. So a tag.customerId=X set on the top-level event
also matches the child runs that run spawned - “show all work for customer X” spans the whole tree.
Limits. At most 20 tags per run; each key up to 64 characters matching [A-Za-z0-9_.-]; each value
up to 256 characters. An over-limit or malformed tag is rejected with a 400 (it is never silently
truncated).
- TypeScript
- REST API
Sending
tags on an event and the tag.<key> runs filter are both supported in the TypeScript SDK.
The wire contract (tags on an event, tag.<key> on the runs filter) is stable, so any language can
use tags over REST.Look up a single run
When you know a run by a business key rather than its Duraton run id - “the run forticketId=123” -
tag it at trigger time and look it up by that tag. This is just the list query with limit=1: the
filters (tag.<key>, app, workflow, status, session) narrow the set, and sort/dir decide
which run you get when several match. There is no separate lookup endpoint - GET /runs already does
it - and no “ambiguous match” error: the newest match wins by default, and you pick a different one by
changing sort/dir.
The TypeScript SDK wraps this as runs.find(opts), which returns the one matching run or null:
- TypeScript
- REST API
For AI agents: the same lookup is an MCP tool,
find_run - call it with tags (plus optional
app/workflow/status and sort/dir) to get one run back as { found, run }. It sits beside
get_run (by id) and list_runs (the full page) in the engine MCP tool list, so an agent can discover
and use it without knowing a run id.Keyset pagination
Paging is cursor-based (keyset), not offset-based. Each response carries up tolimit run
summaries plus an X-Next-Cursor header when more rows exist; pass that value back as ?cursor= to
fetch the next (older) page:
sort/dir it was issued for; changing either invalidates it,
so start a fresh page when the ordering changes.
Run steps
GET /runs/{id}/steps returns the run’s steps, ordered by execution
position and then attempt. It takes no limit - every recorded step row for the run is returned. This
is the read model behind a progress view and the run-detail step list.
Every attempt is returned, not just the latest. Each
(step, attempt) is its own row, ordered by
index then attempt. A step that failed and retried appears as a failed row (with willRetry /
nextAttemptAt) followed by the row for the next attempt - the whole retry history is visible, so you
never have to reconstruct it. To render one row per step, keep the highest-attempt row per index.
- TypeScript
- REST API
Run logs
GET /runs/{id}/logs returns the structured logs a run emitted via ctx.log,
oldest first. Each entry is one captured line:
ctx.log works.
Live run stream
GET /runs/{id}/stream is a Server-Sent Events
stream of a run’s timeline: every status transition and ctx.log line, in order, as they happen. It
replays the timeline from the start on connect, then tails new rows live, and ends on its own once the run
is terminal. See the realtime guide for how it works.
Each event is one timeline frame. The SSE event: line carries the frame kind; the data: object
repeats it so a non-browser client can discriminate without reading the line:
kind, seq, ts, and runId; the rest depends on kind:
On a
step_status frame with status: "failed", willRetry is true and nextAttemptAt is
the ISO time of the next attempt when the step is scheduled to retry; both are absent on a
terminal failure. The same two fields appear on each step from GET /runs/{id}/steps, so a
transient retry renders distinctly from a hard failure on reload as well as on the live stream.
- TypeScript
- REST API
seq. That is what makes a drop recoverable: remember the last seq you processed
and reconnect with ?from=<seq>, and the stream replays every frame after it before tailing again.
Project-wide run stream
GET /runs/stream is the project-level counterpart: an SSE stream of run_status frames across every run
in the project, for keeping a runs list or overview live without polling. It carries only run status
transitions - not steps or logs - to stay bounded.
seq cursor here: a per-run seq is not ordered across
runs, so this stream tails by timestamp and is best-effort. Treat each frame as a signal to refetch
the affected run or the list, not as a lossless log - a missed frame is self-correcting, since the next
transition triggers another refetch that also reflects the run you missed. The console’s runs list and
stats are built on exactly this: they refetch on activity instead of on a timer.
Run stats
GET /runs/stats summarizes the run set for a filter. It accepts app, workflow, replayOf,
parentRunId, and since (the same meaning as above):
Run time series
GET /runs/timeseries buckets the same run set over time - the endpoint behind the console’s run
charts. It accepts app, workflow, and since, plus bucket (the bucket width in seconds, default
3600):
Runs are bucketed by when they started, oldest bucket first, and a
status filter does not apply here
- the point of the series is the status split within each bucket. A query is capped at 5000
(bucket, status) rows, keeping the most recent buckets; widen
bucketto cover a longer window.
parentRunId is deliberately not accepted here, though GET /runs and GET /runs/stats both take
it: one run’s handful of children is a set to list or count, not a rate to chart over time.
AI spend & sessions
Two read endpoints roll up Duraton’s AI metering for observability. Both meter tokens and report cost only where a call supplied one - Duraton holds no price list, socost fields stay absent rather than defaulting to 0.
GET /ai/spend returns window totals plus by-hour, by-model, and by-workflow breakdowns. It accepts
app, workflow, and since (as above), plus bucket (the by-hour width in seconds, default
3600):
avgLatencyMs is the mean call latency across calls that reported one - absent when none did,
never 0-filled - given for the window total and, in byModel, broken out per model (demo-chat-1
and demo-embed-1 above report no latency, so the field is simply absent on those rows). cacheHits
over cacheEligible is the inference-cache hit rate, counting only
calls that used the cache; both stay 0 when no call in the window engaged it.
GET /sessions groups runs into conversation sessions, most recent first. Set an event’s session
to a stable conversation id (the OpenTelemetry gen_ai.conversation.id) to thread its runs together;
omit it and each run is its own session. It accepts app, since, and limit (default 100, max
500):
aiTokens and aiCost are absent when no run in the session made a model call / supplied a cost.
- TypeScript
- REST API